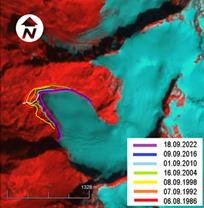
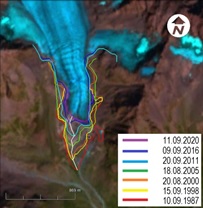
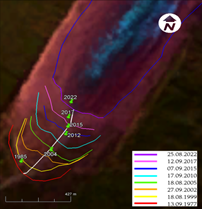
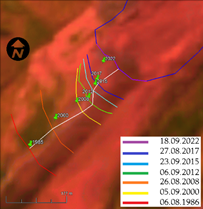
To determine the contours of the retreat of the Shkhara glacier, data from various Landsat satellite sensors were used for the time points indicated on the drawing.
The picture shows a schematic image of the retreat of the Shkhara glacier against the background of the Landsat 9 OLI TIRS sensor image of September 18, 2022. Additionally, on the same image the locations of glacier determined based on GBO with green pins are shown.
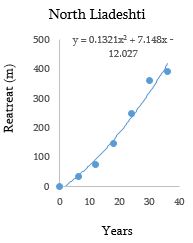
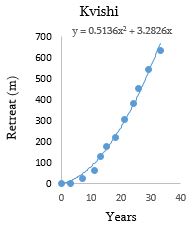
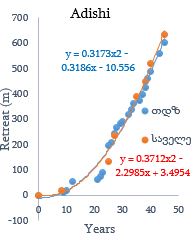
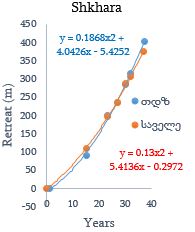
Using the SRS data, the location of glaciers at different points in time has been determined, which are shown by contours of different colors on the schematic image of retreat. The contours have been drawn using manual digitization. The numerical value of glacier Shkhara retreat is calculated by means of the white dashed line crossing the contours. Based on these values retreat graph is created and corresponding trend is shown. As indicated in the drawing, the initial state of the Shkhara Glacier corresponds to 1986.
The conducted analysis showed that the nonlinear retreat of the Shkhara Glacier is described with high accuracy by a second-order polynomial, which in this case is a parabola. The Shkhara Glacier retreat graph constructed based on the field expedition data used for the quality assessment and control of the results is also described with high accuracy by a parabolic curve. As can be seen from graphs comparing the ground data of the SRS and field observations, the ground-based data of the Shkhara Glacier SRS and field observations are in good agreement with each other.